 Data current as of September 2, 2026. Source: Greater Vancouver REALTORS®
For most of this year, North Vancouver's three housing types have moved as a pack — up together in June, back to balanced together in July. In August, the pack broke apart.Townhomes did something nobody was calling: they surged back into seller's-market territory, with sales climbing and inventory tightening to the leanest level in the data. Detached went the opposite direction, sliding to its softest sales month of the year and a sales-to-active ratio that now leans toward buyers. Condos sat in the middle — balanced, but with the one benchmark that actually gave ground this month. And underneath it all, something quietly encouraging happened to prices: year-over-year declines narrowed across every segment, and a handful of blue-chip detached neighbourhoods flipped into positive territory for the first time in a long while.Three property types, three different stories. Here they are.
Detached Homes — The Quietest Month, and a Benchmark That Went the Other Way
- 44 sales | 336 active listings | $2,088,400 benchmark | 13.1% sales-to-active ratio
- Under $1.5M — 4 sales. The entry tier stays scarce, concentrated in Norgate, Calverhall, and Pemberton.
- $1.5M–$2M — 14 sales. The deepest active pool on the board, at 88 listings.
- $2M–$3M — 18 sales. The mid-market again did the heavy lifting, the single busiest band this month.
- $3M–$4M — 5 sales.
- $4M–$5M — 1 sale — and it sat 107 days before it went.
- $5M+ — 2 sales, both quick at an average 19 days. The very top of the market moved faster than the tier just below it.
Neighbourhood Breakdown — Detached
- Canyon Heights NV — 5 sales | $2,212,300 benchmark | -3.1% YoY
- Upper Lonsdale — 5 sales | $2,060,300 benchmark | -5.0% YoY
- Deep Cove — 4 sales | $1,982,800 benchmark | -3.5% YoY
- Lower Lonsdale — 4 sales | $2,146,100 benchmark | -7.6% YoY
- Lynn Valley — 3 sales | $1,964,400 benchmark | -1.8% YoY
- Seymour NV — 3 sales | $1,738,200 benchmark | -4.9% YoY
- Boulevard — 2 sales | $2,202,500 benchmark | -5.8% YoY
- Grouse Woods — 2 sales | $2,255,500 benchmark | -4.4% YoY
- Pemberton NV — 2 sales | $1,500,000 benchmark | -6.6% YoY
- Queensbury — 2 sales | $1,921,600 benchmark | -0.9% YoY
- Blueridge NV — 1 sale | $2,104,900 benchmark | -2.1% YoY
- Central Lonsdale — 1 sale | $1,867,500 benchmark | -6.8% YoY
- Dollarton — 1 sale | $2,364,700 benchmark | -3.7% YoY
- Edgemont — 1 sale | $2,753,000 benchmark | +0.3% YoY
- Forest Hills NV — 1 sale | $3,125,900 benchmark | +0.7% YoY
- Indian River — 1 sale | $1,959,400 benchmark | -2.3% YoY
- Pemberton Heights — 1 sale | $2,224,400 benchmark | -7.2% YoY
- Princess Park — 1 sale | $2,134,200 benchmark | -3.2% YoY
- Westlynn — 1 sale | $1,745,700 benchmark | -2.9% YoY
- Calverhall — 0 sales | $1,760,500 benchmark | -5.7% YoY
- Capilano NV — 0 sales | $2,288,600 benchmark | +0.4% YoY
- Delbrook — 0 sales | $2,266,600 benchmark | -5.1% YoY
- Norgate — 0 sales | $1,445,600 benchmark | -5.8% YoY
- Roche Point — 0 sales | $1,787,100 benchmark | -1.8% YoY
- Tempe — 0 sales | $2,172,400 benchmark | -3.6% YoY
- Upper Delbrook — 0 sales | $2,225,300 benchmark | -4.3% YoY
- Windsor Park NV — 0 sales | $2,044,500 benchmark | -3.4% YoY
Condos — Volume Held Up, but the Benchmark Blinked
- 62 sales | 416 active listings | $770,300 benchmark | 14.9% sales-to-active ratio
- Under $700K — the entry tier, still the deepest well of demand
- $400K–$900K — 39 sales, roughly 63% of the entire condo market, driven by the two Lonsdale corridors
- $900K–$1.5M — 16 sales, the move-up and newer-concrete tier
- Over $1.2M — just 4 sales above $1.5M all month; the top of the condo market is thin
Neighbourhood Breakdown — Condos
- Lower Lonsdale — 22 sales | $743,500 benchmark | -4.7% YoY
- Central Lonsdale — 10 sales | $778,000 benchmark | -2.8% YoY
- Lynnmour — 6 sales | $865,500 benchmark | -3.1% YoY
- Pemberton NV — 6 sales | $490,600 benchmark | -9.7% YoY
- Roche Point — 5 sales | $766,600 benchmark | -1.7% YoY
- Lynn Valley — 3 sales | $893,600 benchmark | -2.8% YoY
- Edgemont — 2 sales | $1,074,400 benchmark | -13.7% YoY
- Northlands — 2 sales | $1,016,000 benchmark | +2.4% YoY
- Harbourside — 1 sale | $855,100 benchmark | -10.6% YoY
- Mosquito Creek — 1 sale | $677,800 benchmark | -0.4% YoY
- Norgate — 1 sale | $774,000 benchmark | -9.7% YoY
- Upper Lonsdale — 1 sale | $676,300 benchmark | -2.1% YoY
- Capilano NV — 0 sales | $1,010,500 benchmark | -6.6% YoY
- Indian River — 0 sales | $896,700 benchmark | -1.3% YoY
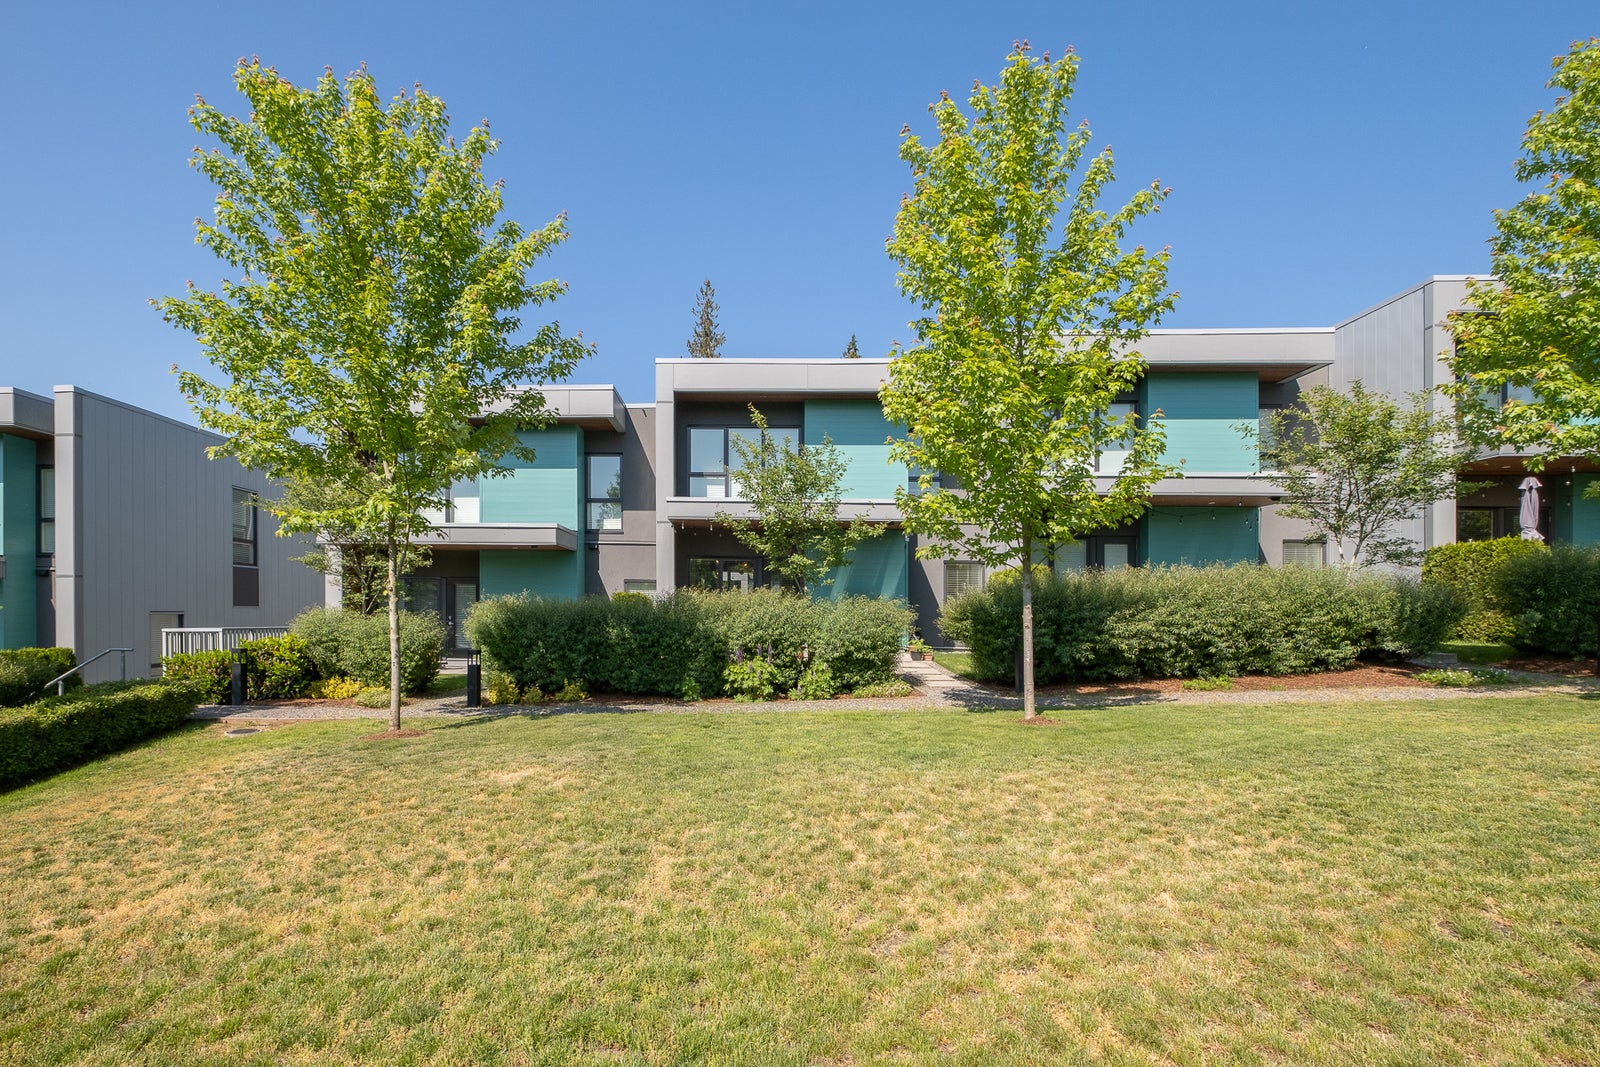
Townhomes — The Segment That Flipped the Whole Story
- 29 sales | 137 active listings | $1,247,400 benchmark | 21.2% sales-to-active ratio
- Under $900K — 2 sales. Older or smaller stock.
- $900K–$1.5M — 23 sales, a commanding 79% of the market, and the tier where the seller's-market pressure is most intense.
- $1.5M–$2M — 4 sales, premium and larger-format product.
Neighbourhood Breakdown — Townhomes
- Central Lonsdale — 5 sales | $1,284,000 benchmark | -2.4% YoY
- Lower Lonsdale — 5 sales | $1,306,300 benchmark | -3.4% YoY
- Lynnmour — 4 sales | $1,054,400 benchmark | -3.5% YoY
- Roche Point — 4 sales | $1,261,000 benchmark | -2.7% YoY
- Lynn Valley — 3 sales | $1,292,900 benchmark | -0.5% YoY
- Edgemont — 1 sale | $1,760,900 benchmark | -2.9% YoY
- Norgate — 1 sale | $1,133,100 benchmark | -4.5% YoY
- Northlands — 1 sale | $1,323,600 benchmark | -2.4% YoY
- Upper Lonsdale — 1 sale | $1,068,300 benchmark | +4.4% YoY
- Westlynn — 1 sale | $1,156,300 benchmark | -3.2% YoY
- Indian River — 0 sales | $1,265,300 benchmark | -2.5% YoY
- Mosquito Creek — 0 sales | $1,129,200 benchmark | -4.3% YoY
- Pemberton NV — 0 sales | $1,381,700 benchmark | -4.2% YoY
- Seymour NV — 0 sales | $1,122,500 benchmark | -2.9% YoY
What the Numbers Actually Mean Right Now
August is the month North Vancouver stopped moving as one market and started moving as three.Townhomes are the story. A jump back into seller's-market territory, rising sales, the leanest inventory in the data, a firming benchmark, and the narrowest year-over-year decline of any segment — every arrow points the same way. If you own a townhome in the $900K–$1.5M core, this is the strongest hand you have held in months. If you are buying one, you are competing, and Upper Lonsdale aside, value is getting harder to find.Detached is the patient market — but not a weak one. Yes, sales hit a yearly low and the ratio leans toward buyers. But the benchmark rose, inventory shrank, and the top-tier neighbourhoods — Edgemont, Forest Hills, Capilano — turned outright positive. Read together, that is a market where buyers have time and choice in the mid-tier, while the scarce, premium pockets are quietly finding a floor. The read depends entirely on which street you are standing on.Condos are the soft-but-stable middle. Volume held, days on market improved, but the benchmark gave a little ground. Nothing here suggests distress — inventory is contracting and the year-over-year trend is still improving — but pricing discipline matters, especially above $900K where the buyer pool thins out fast.The throughline across all three: this is a market that rewards precision. In a month where one segment ran hot, one ran cool, and benchmarks moved in three different directions, the generic "the market is up" or "the market is down" headline is useless. What matters is your property type, your price band, and your neighbourhood — and right now those three variables can point in completely opposite directions on the same week. Pricing to that reality, from day one, is what separated the homes that sold in August from the ones still sitting.That precise read — which segment, which band, which street — is exactly the work we do on every valuation.Work With Wallace Green
Have questions about where your home sits in this market — or which neighbourhoods represent the best value right now? Scott and Carson at Wallace Green Real Estate Group are here to help. Having helped 500+ buyers and sellers over the past decade, we bring deep local knowledge to every transaction. Schedule a consultation or search current listings at wallacegreen.ca.This representation is based in whole or in part on data generated by the Chilliwack and District Real Estate Board, Fraser Valley Real Estate Board or Greater Vancouver REALTORS®, which assumes no responsibility for its accuracy.Source: Greater Vancouver REALTORS®, August 2026 REALTOR® Report. Data current as of September 2, 2026. Report © 2026 ShowingTime Plus, LLC. All benchmark prices are MLS® HPI Benchmark Prices. Percent changes are calculated using rounded figures. A neighbourhood shown without a benchmark price indicates insufficient sales activity to report a benchmark value — not a $0 sale price. Wallace Green Real Estate Group does not predict future market performance.