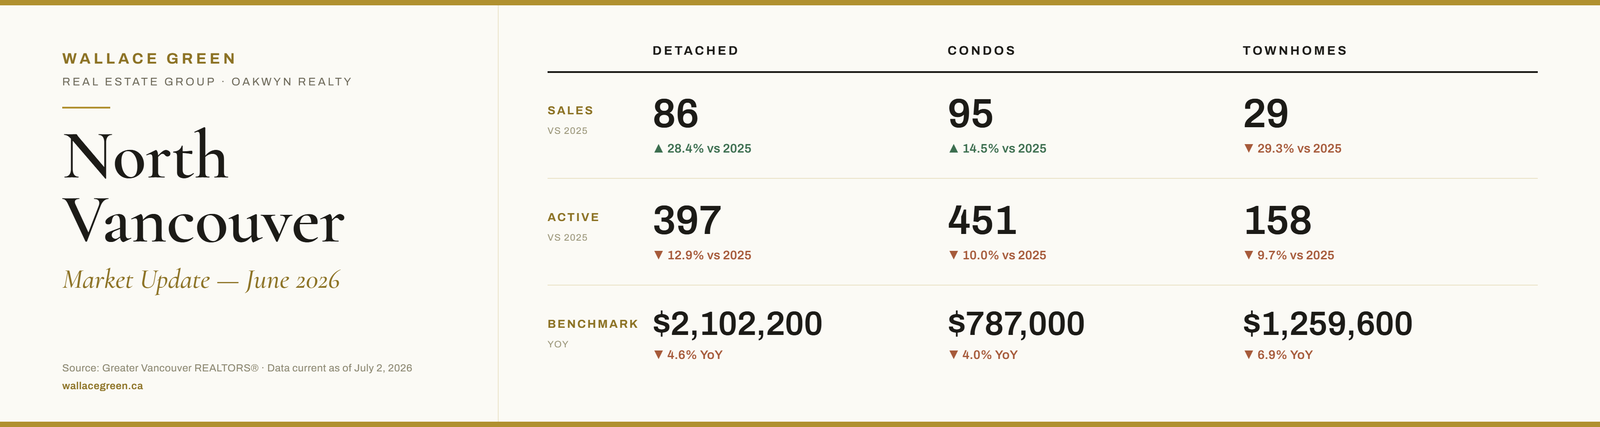
Data current as of July 2, 2026. Source: Greater Vancouver REALTORS®June flipped the script on the spring. For months, detached homes were the patient, buyer-leveraged corner of the North Vancouver market while condos and townhomes did the heavy lifting on volume. In June, detached sales surged to their highest level in a full year, inventory thinned, and the segment tightened decisively into seller's market territory. Condos held their momentum with another strong month and, for the first time in a while, a benchmark that actually ticked upward. Townhomes were the one segment to take a breather — fewer sales and a benchmark that gave back some of its spring recovery — though they remain balanced and fast-moving. Across all three, days on market are still running ahead of last year, and benchmark prices remain softer year over year. But the month-over-month direction has changed, and two of the three segments are now firmly in seller's market conditions.Here is the full breakdown.
Detached Homes — Sales Surge to a One-Year High
- 86 sales | 397 active listings | $2,102,200 benchmark | 21.7% sales-to-active ratio
Where the Price Action Is — Detached
- Under $1.5M — 5 sales. Still a very thin market. Entry-level detached remains almost nonexistent in North Vancouver, concentrated in Norgate, Calverhall, Westlynn, and select east-side pockets.
- $1.5M–$2M — 34 sales. A deep, competitive corridor with 116 active listings behind it.
- $2M–$3M — 38 sales. The mid-market took over the top spot this month, edging out the $1.5M–$2M band and representing the single largest slice of detached activity.
- $3M–$4M — 7 sales. A stronger showing at the upper-mid tier.
- $4M–$5M — 2 sales. Selective, condition-driven.
- $5M+ — 0 sales. Twelve active listings, no transactions.
Neighbourhood Breakdown — Detached
Volume was broad-based this month, with strength spread across Lynn Valley, Upper Lonsdale, Canyon Heights, and a standout showing from Calverhall. Nearly every neighbourhood posted a year-over-year benchmark decline, but the range between the most resilient and the most corrected areas remains wide:- Lynn Valley — 10 sales | $2,010,800 benchmark | -1.4% YoY
- Upper Lonsdale — 9 sales | $2,117,700 benchmark | -3.8% YoY
- Canyon Heights NV — 8 sales | $2,220,000 benchmark | -4.2% YoY
- Calverhall — 7 sales | $1,790,000 benchmark | -6.4% YoY
- Deep Cove — 5 sales | $1,948,400 benchmark | -5.5% YoY
- Indian River — 5 sales | $1,918,500 benchmark | -6.5% YoY
- Princess Park — 5 sales | $2,149,700 benchmark | -3.9% YoY
- Boulevard — 4 sales | $2,203,600 benchmark | -6.7% YoY
- Westlynn — 4 sales | $1,776,200 benchmark | -4.4% YoY
- Blueridge NV — 3 sales | $2,100,600 benchmark | -4.2% YoY
- Dollarton — 3 sales | $2,290,700 benchmark | -8.9% YoY
- Edgemont — 2 sales | $2,718,500 benchmark | -2.6% YoY
- Pemberton Heights — 2 sales | $2,232,200 benchmark | -7.2% YoY
- Pemberton NV — 2 sales | $1,485,100 benchmark | -8.8% YoY
- Windsor Park NV — 2 sales | $2,002,400 benchmark | -7.4% YoY
- Delbrook — 1 sale | $2,302,100 benchmark | -5.0% YoY
- Forest Hills NV — 1 sale | $3,134,700 benchmark | -0.8% YoY
- Grouse Woods — 1 sale | $2,291,700 benchmark | -3.0% YoY
- Lower Lonsdale — 1 sale | $2,191,600 benchmark | -7.3% YoY
- Queensbury — 1 sale | $1,860,000 benchmark | -7.1% YoY
- Seymour NV — 1 sale | $1,811,000 benchmark | -2.4% YoY
- Upper Delbrook — 1 sale | $2,237,900 benchmark | -6.1% YoY
- Central Lonsdale — 5 sales | $1,867,400 benchmark | -9.2% YoY
Condos — Momentum Holds, and the Benchmark Turns Up
- 95 sales | 451 active listings | $787,000 benchmark | 21.1% sales-to-active ratio
Where Condo Buyers Are Active by Price Range
The North Vancouver condo market remains an overwhelmingly sub-$1.5M conversation:- Under $400K — 1 sale. Essentially gone from North Vancouver.
- $400K–$900K — 64 sales. The engine of the market, at 67% of all condo transactions, with 283 active listings behind it.
- $900K–$1.5M — 29 sales. The move-up tier remains healthy.
- $1.5M–$2M — 0 sales. No transactions against 17 active listings.
- $2M+ — 1 sale. A single transaction in the $2M–$3M range.
Neighbourhood Breakdown — Condos
The two Lonsdale corridors carried the month, both up meaningfully from May:- Lower Lonsdale — 32 sales | $759,700 benchmark | -4.0% YoY
- Central Lonsdale — 21 sales | $780,700 benchmark | -8.3% YoY
- Lynn Valley — 11 sales | $931,300 benchmark | -0.1% YoY
- Pemberton NV — 8 sales | $511,300 benchmark | -9.2% YoY
- Lynnmour — 7 sales | $907,800 benchmark | +0.1% YoY
- Roche Point — 6 sales | $758,900 benchmark | -3.6% YoY
- Harbourside — 3 sales | $877,900 benchmark | -11.2% YoY
- Northlands — 2 sales | $994,500 benchmark | -2.4% YoY
- Upper Lonsdale — 2 sales | $709,000 benchmark | +0.8% YoY
- Mosquito Creek — 1 sale | $668,000 benchmark | -7.8% YoY
- Capilano NV — 0 sales | $1,016,200 benchmark | -10.3% YoY
- Indian River — 0 sales | $901,300 benchmark | -2.6% YoY
- Norgate — 0 sales | $801,900 benchmark | -11.4% YoY
Townhomes — A Lighter Month After a Strong Spring
- 29 sales | 158 active listings | $1,259,600 benchmark | 18.4% sales-to-active ratio
Where Townhome Buyers Are Concentrating
- Under $900K — 0 sales. No activity in the lowest tier this month.
- $900K–$1.5M — 27 sales. The core of the market at 93% of all transactions, with the $1.1M–$1.4M range the consistent sweet spot.
- $1.5M–$2M — 2 sales. Premium format or premium location.
- $2M+ — 0 sales.
Neighbourhood Breakdown — Townhomes
- Lower Lonsdale — 5 sales | $1,298,100 benchmark | -8.4% YoY
- Lynnmour — 5 sales | $1,081,800 benchmark | -6.9% YoY
- Roche Point — 4 sales | $1,286,800 benchmark | -5.9% YoY
- Central Lonsdale — 3 sales | $1,288,000 benchmark | -5.6% YoY
- Westlynn — 3 sales | $1,165,700 benchmark | -7.0% YoY
- Indian River — 2 sales | $1,289,500 benchmark | -6.2% YoY
- Lynn Valley — 2 sales | $1,320,100 benchmark | -5.6% YoY
- Seymour NV — 2 sales | $1,152,700 benchmark | -6.9% YoY
- Edgemont — 1 sale | $1,793,100 benchmark | -5.2% YoY
- Mosquito Creek — 1 sale | $1,133,200 benchmark | -7.0% YoY
- Pemberton NV — 1 sale | $1,384,200 benchmark | -8.2% YoY
- Norgate — 0 sales | $1,125,000 benchmark | -7.8% YoY
- Northlands — 0 sales | $1,331,200 benchmark | -7.5% YoY
- Upper Lonsdale — 0 sales | $1,041,500 benchmark | -6.5% YoY
What the Numbers Actually Mean Right Now
June marked a genuine change in direction. Detached, which had spent the spring as the most patient and buyer-friendly segment, saw sales climb to a twelve-month high while inventory contracted — pushing the market into seller's territory at 21.7%. The benchmark holding flat despite that volume tells a specific story: demand met supply almost exactly, absorbing listings without forcing prices up. Buyers who had leverage a few months ago are now competing harder, particularly in the $1.5M–$3M band where most of the activity sits.Condos are the segment to watch. Two consecutive months in the high-90s on sales, contracting inventory, and a benchmark that finally moved up after a long stretch of flat readings. That combination — strong volume plus a firming benchmark — is the clearest sign yet that the condo correction has found its floor and buyer demand is beginning to translate into price support, especially in the sub-$900K tier that drives the market.Townhomes had a quieter month, and that is worth putting in context rather than over-reading. Volume dropped and the benchmark eased after three months of gains, but days on market improved and the segment stayed balanced. For buyers who want ground-level product without a detached price tag, the current window — particularly in Lower Lonsdale, Central Lonsdale, and Lynn Valley — still offers real value relative to where benchmarks sat twelve to eighteen months ago.The through-line across all three: North Vancouver tightened in June. Two of the three segments are now in seller's market conditions, and inventory contracted year over year in every category. Accurate pricing from day one still matters — the data continues to reward sellers who price correctly over those who test high and reduce later — but the leverage story that defined the spring is clearly shifting.Work With Wallace Green
Have questions about where your home sits in this market — or which neighbourhoods represent the best value right now? Scott and Carson at Wallace Green Real Estate Group are here to help. Having helped 500+ buyers and sellers over the past decade, we bring deep local knowledge to every transaction. Schedule a consultation or search current listings at wallacegreen.ca.This representation is based in whole or in part on data generated by the Chilliwack and District Real Estate Board, Fraser Valley Real Estate Board or Greater Vancouver REALTORS®, which assumes no responsibility for its accuracy.Source: Greater Vancouver REALTORS®. Data current as of July 2, 2026. Report © 2026 ShowingTime Plus, LLC. All benchmark prices are MLS® HPI Benchmark Prices. Percent changes are calculated using rounded figures. A neighbourhood shown without a benchmark price indicates insufficient sales activity to report a benchmark value — not a $0 sale price. Wallace Green Real Estate Group does not predict future market performance.