- Data current as of June 2, 2026. Source: Greater Vancouver REALTORS®
North Vancouver Real Estate — May 2026 Market Update
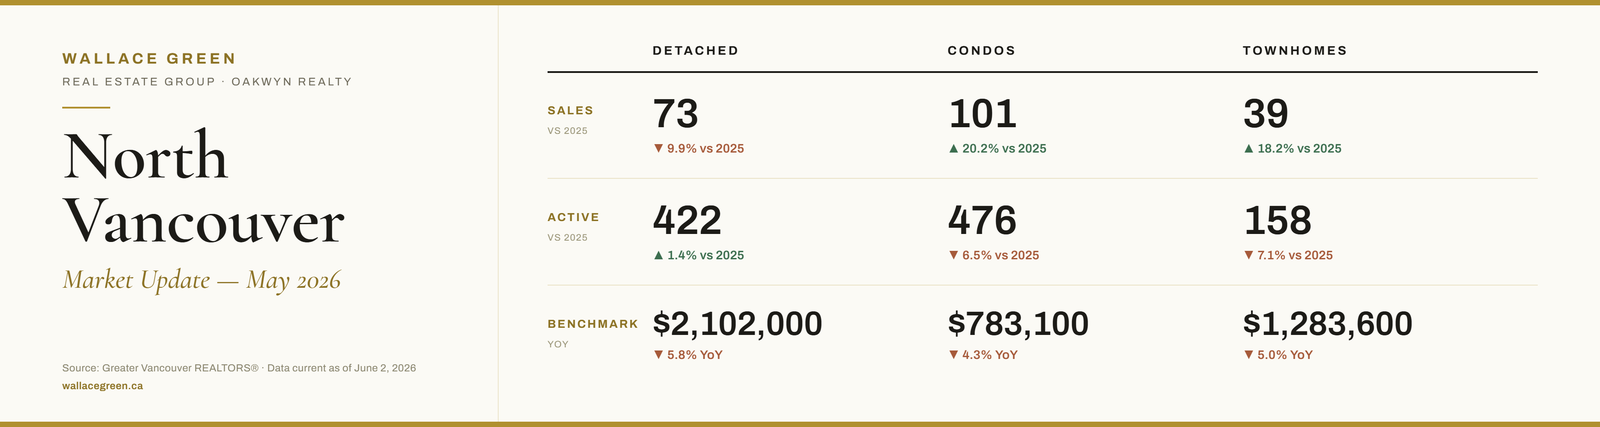
Data current as of June 2, 2026. Source: Greater Vancouver REALTORS®May delivered the most interesting split reading of the spring season so far. Condos surged back with 101 sales — their strongest month since before the current correction cycle — while detached slipped again year over year and townhomes continued their quiet but consistent recovery. Across all three segments, days on market remain elevated well above last year's pace, and benchmark prices are softer across the board. But the underneath-the-surface story in condos and townhomes is more nuanced than the headline numbers suggest, and the detached neighbourhood data tells two very different stories depending on where you are looking.Here is the full breakdown.
Detached Homes — Volume Softens, But the Neighbourhood Split Widens
- 73 sales | 422 active listings | $2,102,000 benchmark | 17.3% sales-to-active ratio
Browse all North Vancouver houses for sale →Detached sales came in at 73 — down 9.9% from 81 in May 2025, and a slight pullback from 69 in April. Inventory held at 422 active listings, up just 1.4% year over year, making this the most stable inventory reading of the three segments. Days on market averaged 28 days, up 55.6% from 18 days a year ago — a number that continues to reflect buyers taking their time.The benchmark retreated to $2,102,000, down from $2,129,900 in April and down 5.8% from $2,230,600 in May 2025. That monthly dip is worth noting: after two consecutive months of benchmark recovery in March and April, May gave back some of that ground. The broader trend since the February low of $2,031,700 still points upward, but it is not a straight line.The sales-to-active ratio of 17.3% keeps detached homes in buyer's market territory for the fourth consecutive month.
Where the Price Action Is — Detached
- Under $1.5M — 6 sales. Still a thin market. Entry-level detached is almost nonexistent in North Vancouver, concentrated in Norgate, Westlynn, and select east-side pockets.
- $1.5M–$2M — 34 sales. The dominant price range for the second consecutive month. This corridor is where most of the competitive activity in North Shore detached homes now lives.
- $2M–$3M — 25 sales. The mid-market remains active, down from 31 in April but still representing meaningful volume.
- $3M–$5M — 5 sales. Selective, condition-driven.
- $5M+ — 3 sales. The ultra-premium end had a slightly stronger showing than recent months — 2 in the $4M–$5M range and 1 above $5M.
Neighbourhood Breakdown — Detached
May was a tale of two markets. Lynn Valley, Canyon Heights, Blueridge, Boulevard, Forest Hills, and Edgemont all posted meaningful sales volume. Nearly every neighbourhood showed a year-over-year benchmark decline, but the magnitude varied significantly:- Lynn Valley — 13 sales | $2,020,900 benchmark | -3.8% YoY
- Canyon Heights NV — 7 sales | $2,235,600 benchmark | -6.6% YoY
- Blueridge NV — 7 sales | $2,052,100 benchmark | -5.2% YoY
- Upper Lonsdale — 6 sales | $2,147,800 benchmark | -5.5% YoY
- Boulevard — 6 sales | $2,136,200 benchmark | -8.6% YoY
- Forest Hills NV — 4 sales | $3,090,300 benchmark | -3.9% YoY
- Deep Cove — 4 sales | $1,920,200 benchmark | -6.4% YoY
- Edgemont — 3 sales | $2,705,600 benchmark | -5.6% YoY
- Indian River — 3 sales | $1,885,600 benchmark | -6.4% YoY
- Princess Park — 3 sales | $2,119,200 benchmark | -7.2% YoY
- Dollarton — 3 sales | $2,246,600 benchmark | -9.9% YoY
- Pemberton Heights — 2 sales | $2,286,700 benchmark | -4.3% YoY
- Upper Delbrook — 2 sales | $2,246,200 benchmark | -8.2% YoY
- Central Lonsdale — 2 sales | $1,917,900 benchmark | -5.8% YoY
- Westlynn — 2 sales | $1,758,100 benchmark | -3.7% YoY
- Capilano NV — 1 sale | $2,323,300 benchmark | -5.1% YoY
- Lower Lonsdale — 1 sale | $2,195,000 benchmark | -5.7% YoY
- Mosquito Creek — 1 sale | no benchmark recorded
- Norgate — 1 sale | $1,540,400 benchmark | -2.4% YoY
- Northlands — 1 sale | no benchmark recorded
- Queensbury — 1 sale | $1,809,000 benchmark | -6.1% YoY
Condos — The Strongest Month in Over a Year
- 101 sales | 476 active listings | $783,100 benchmark | 21.2% sales-to-active ratio
Browse all North Vancouver condos for sale →May was a genuinely strong month for condos. 101 sales is the highest single-month condo total in North Vancouver since before the current correction period began in mid-2025. It represents a 20.2% year-over-year increase from 84 in May 2025 and a significant rebound from 67 sales in April. The sales-to-active ratio jumped to 21.2% — the only segment in balanced market territory this month, and the strongest condo reading in well over a year.That said, the benchmark tells a different story: $783,100, down slightly from $784,500 in April and down 4.3% from $818,300 in May 2025. Strong sales volume is not yet translating into upward price pressure. Active listings at 476 are down 6.5% year over year — the only segment where inventory actually contracted relative to last year — which helps explain why buyers are active but not why sellers are getting more than they were a year ago.Days on market averaged 35 days, up 34.6% from 26 days in May 2025. Buyers are shopping with more deliberation even when they ultimately transact.
Where Condo Buyers Are Active by Price Range
The North Vancouver condo market is an overwhelmingly sub-$1.5M conversation:- Under $400K — 1 sale. Essentially gone from North Vancouver condos.
- $400K–$900K — 72 sales. The engine of the condo market. This single price range accounted for 71% of all condo transactions in May. Supply is deep here at 296 active listings.
- $900K–$1.5M — 25 sales. The move-up tier remains active. Lynn Valley and Northlands product dominates.
- $1.5M–$2M — 1 sale. A thin, specialized market.
- $2M+ — 2 sales.
Neighbourhood Breakdown — Condos
Lynnmour was the standout story of the month, posting 19 sales — an unusually high reading for that neighbourhood and nearly double its typical monthly pace. Lower Lonsdale and Central Lonsdale retained their roles as the district's condo volume leaders:- Lower Lonsdale — 27 sales | $788,100 benchmark | -1.4% YoY
- Central Lonsdale — 11 sales | $778,100 benchmark | -6.7% YoY
- Lynnmour — 19 sales | $869,500 benchmark | -7.2% YoY
- Lynn Valley — 9 sales | $896,800 benchmark | -7.1% YoY
- Roche Point — 9 sales | $765,600 benchmark | -0.1% YoY
- Pemberton NV — 6 sales | $485,800 benchmark | -10.6% YoY
- Mosquito Creek — 5 sales | $662,300 benchmark | -7.0% YoY
- Upper Lonsdale — 4 sales | $677,900 benchmark | -6.8% YoY
- Harbourside — 2 sales | $841,700 benchmark | -13.4% YoY
- Capilano NV — 2 sales | $992,300 benchmark | -10.8% YoY
- Edgemont — 1 sale | $1,140,300 benchmark | -7.7% YoY
- Northlands — 1 sale | $996,800 benchmark | +1.4% YoY
- Deep Cove — 1 sale | no benchmark recorded
- Delbrook — 1 sale | no benchmark recorded
- Queensbury — 2 sales | no benchmark recorded
Townhomes — Steady Recovery Continues
- 39 sales | 158 active listings | $1,283,600 benchmark | 24.7% sales-to-active ratio
Townhomes continued their quiet but consistent recovery in May. 39 sales represents an 18.2% year-over-year increase from 33 in May 2025, and the sales-to-active ratio held at 24.7% — balanced market territory for the second consecutive month. Inventory actually contracted slightly to 158 active listings from 159 in April, down 7.1% from 170 a year ago — the only declining inventory reading among all three segments.The benchmark reached $1,283,600, up from $1,273,700 in April — the third consecutive monthly gain and a meaningful recovery from the cycle low of $1,253,800 in February. Year over year the benchmark is still down 5.0% from $1,350,700, but the directional trend over the past three months is clearly positive.Days on market came in at 26 days, down from 31 days in April, suggesting that correctly priced townhomes are moving a bit faster than last month.
Source: Greater Vancouver REALTORS®. Data current as of June 2, 2026. Report © 2026 ShowingTime Plus, LLC. All benchmark prices are MLS® HPI Benchmark Prices. Percent changes are calculated using rounded figures. A neighbourhood shown without a benchmark price indicates insufficient sales activity to report a benchmark value — not a $0 sale price.
Where Townhome Buyers Are Concentrating
- Under $900K — 3 sales. Older or smaller stock, primarily east side.
- $900K–$1.5M — 30 sales. The core of the townhome market — 77% of all transactions in May. The $1.1M–$1.4M range remains the sweet spot where supply, demand, and value proposition align best.
- $1.5M–$2M — 6 sales. Premium format or premium-location product.
- $2M+ — 0 sales.
Neighbourhood Breakdown — Townhomes
- Lower Lonsdale — 10 sales | $1,327,100 benchmark | -5.8% YoY
- Central Lonsdale — 8 sales | $1,311,500 benchmark | -3.8% YoY
- Lynnmour — 5 sales | $1,094,100 benchmark | -5.6% YoY
- Lynn Valley — 4 sales | $1,342,700 benchmark | -3.4% YoY
- Pemberton NV — 2 sales | $1,405,800 benchmark | -6.7% YoY
- Roche Point — 2 sales | $1,310,800 benchmark | -4.9% YoY
- Indian River — 1 sale | $1,312,800 benchmark | -5.2% YoY
- Mosquito Creek — 1 sale | $1,156,900 benchmark | -4.6% YoY
- Norgate — 1 sale | $1,151,000 benchmark | -4.3% YoY
- Seymour NV — 1 sale | $1,179,800 benchmark | -4.4% YoY
- Upper Lonsdale — 1 sale | $1,065,000 benchmark | -3.3% YoY
- Westlynn — 1 sale | $1,185,800 benchmark | -6.6% YoY
- Deep Cove — 1 sale | no benchmark recorded
- Queensbury — 1 sale | no benchmark recorded
What the Numbers Actually Mean Right Now
Condos showed real buyer demand in May. 101 transactions is not a soft market. The question is whether June carries the momentum or reverts toward April's 67. The benchmark remaining flat despite strong sales tells us there is still enough supply to absorb buyer demand without pushing prices upward. That is a healthy, functioning market — not distressed and not frenzied.Townhomes are in the best relative shape of the three segments. Three consecutive months of benchmark recovery, contracting inventory, and a sales-to-active ratio holding balanced market territory for two straight months. For buyers who want ground-level product without a detached price tag, the current window in North Vancouver townhomes — particularly in Lower Lonsdale, Lynn Valley, and Central Lonsdale — offers real value relative to where benchmarks were twelve to eighteen months ago.Detached is the most patient market. At 17.3% sales-to-active, buyers have the leverage and they know it. The $1.5M–$2M band is the most competitive pocket of the detached market and the best evidence that motivated buyers at the right price point still exist in meaningful numbers. Sellers who price accurately from day one are consistently outperforming those who test high and reduce later.Work With Wallace Green
Have questions about where your home sits in this market — or which neighbourhoods represent the best value right now? Scott and Carson at Wallace Green Real Estate Group are here to help. With 500+ homes sold over the past decade, we bring deep local knowledge to every transaction. Schedule a consultation or search current listings at wallacegreen.ca.Source: Greater Vancouver REALTORS®. Data current as of June 2, 2026. Report © 2026 ShowingTime Plus, LLC. All benchmark prices are MLS® HPI Benchmark Prices. Percent changes are calculated using rounded figures. A neighbourhood shown without a benchmark price indicates insufficient sales activity to report a benchmark value — not a $0 sale price.